Usage & Performance Metrics for Every PocketBase Instance
Usage & Performance Metrics for Every PocketBase Instance
“Is it slow, or is it just me?” is a question you should never have to answer by SSH-ing into a box — especially on a platform where you don’t get an SSH key in the first place.
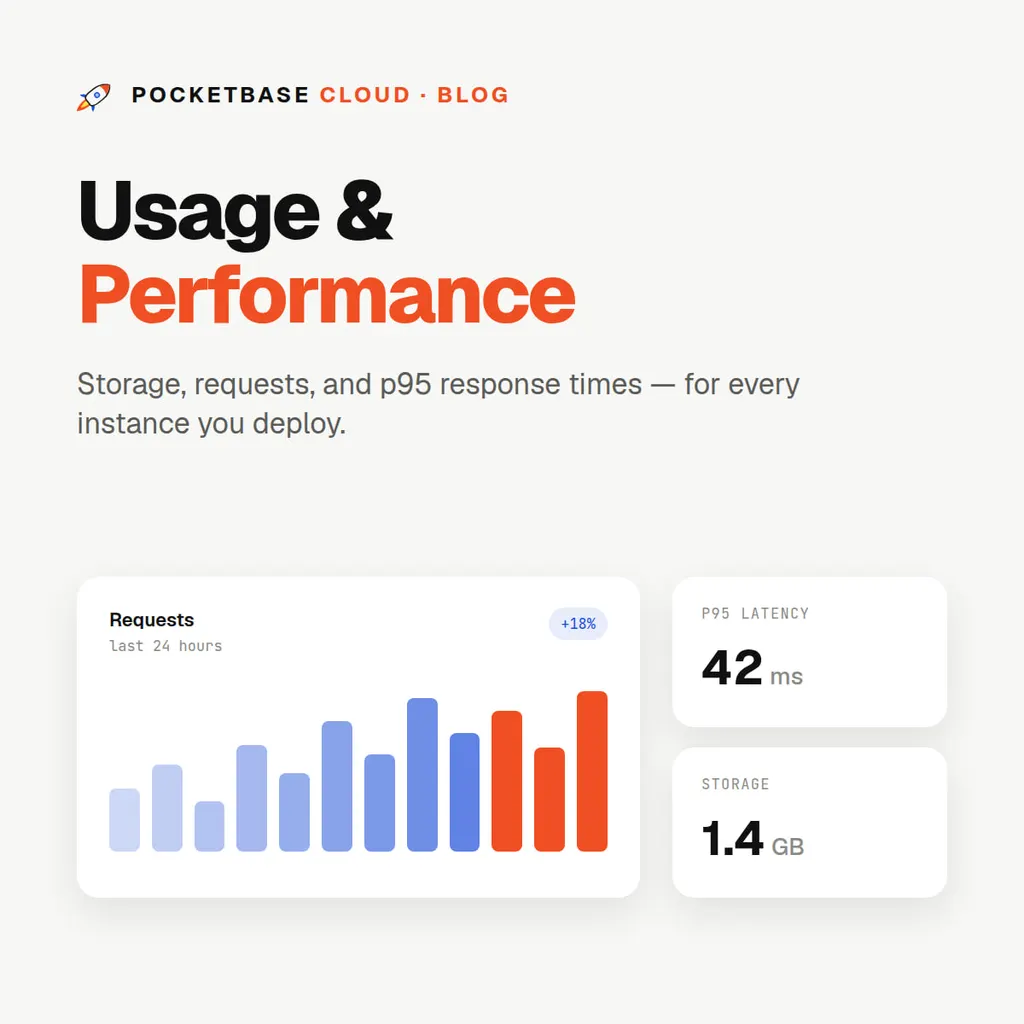
Until now, PocketBase Cloud could tell you a lot about servers and almost nothing about the thing you actually deployed. That was backwards: servers are hidden infrastructure here, and most accounts can’t even see one. So we built the view that was missing. Every PocketBase instance, backend and frontend now has its own Usage & performance page in the portal.
What you get
Four signals, per resource, on one page:
| Signal | What it answers |
|---|---|
| Storage on disk | How big has this instance actually grown? |
| Requests over time | When does traffic arrive, and how much of it? |
| Median and p95 response times | Is it slow for everyone, or slow for the tail? |
| CPU and memory | Is the container near its limits, or coasting? |
Open any PocketBase instance, backend or frontend in the portal and click Usage & performance. There is nothing to install, no agent to configure, and no sampling library to add to your code — the numbers are collected on the host, not in your application.
Where the numbers come from
Three different measurements, three different sources, all gathered on the VM by our agent:
- Storage is a real
duof the instance’s directory — the whole thing, not an estimate from record counts. PocketBase instances also reportpb_dataon its own, so you can see how much of your footprint is database versus uploaded files. - Traffic and latency come from the web server’s own access log, aggregated per hostname. That means every request that reached your domain is counted, including the ones your app returned a 404 or a 403 for.
- CPU and memory are read from the container’s cgroup, so what you see is what the container used — not what the whole machine was doing.
Two cadences, on purpose
Traffic and CPU/memory are collected every five minutes. Disk usage is measured hourly.
That difference isn’t laziness, it’s a deliberate trade. Walking every file in an instance to compute its size is by far the most expensive thing in this pipeline, and running it every five minutes on every instance on a host is the kind of background work that quietly shows up in your response times. So it runs at most hourly per resource, at low I/O and CPU priority, and the measured figure is carried on the five-minute rows in between.
The practical effect: “current storage” is always the latest row — measured hourly, reported continuously. Upload a 200 MB file and the chart catches up within the hour, not within five minutes. Everything else is near-live.
Deltas, not counters
Traffic is reported as a delta over a known window rather than a running total.
This matters more than it sounds. A cumulative counter resets whenever the process behind it restarts, and a naive dashboard reads that reset as a gigantic negative — or, worse, reads the first post-restart sample as a spike of millions of requests. Reporting the delta for a window that we know the bounds of means an agent restart, a web server reload or a deploy can never manufacture traffic that didn’t happen.
A gap means a gap
If collection fails for a window, the chart shows a gap and says so.
The tempting alternative — drawing zero — is a lie that costs you real time. Zero traffic and “we couldn’t measure your traffic” look identical on a chart but mean opposite things: one is a quiet night, the other is a broken sensor. When you’re staring at a dashboard at 2am trying to work out whether your app died, the difference is the whole point of having the dashboard.
What to actually do with it
A few patterns worth knowing:
- p95 far above median means a slow tail, not a slow app. Look for one expensive query, an unindexed filter, or a large file download — not a general capacity problem.
- Storage climbing while records stay flat is usually uploaded files or accumulated backups. Backups live on the instance and count toward its storage, so a daily backup schedule with no retention limit will grow forever.
- CPU spiky but memory flat is normal for PocketBase — it’s a Go binary with SQLite behind it, and it idles cheaply between bursts.
- Requests with no matching latency change under growing traffic is the good outcome: you have headroom.
Where to find it
- Per-resource detail: open a PocketBase instance, backend or frontend → Usage & performance
- Everything at once: the portal’s Usage page lists storage and traffic for every resource on your account in one table
Both are available on every plan, at no extra cost. If you’re running something in production, it’s worth opening the p95 chart once a week — it’s the cheapest early warning you’ll get.
Want the background on how instances are isolated and where the data physically lives? See Security & data. For instance-level operations — backups, exports, logs — see Managing Your Instance.